from orbit_generation.data import get_example_orbit_data
from orbit_generation.constants import EM_POINTSVisualization
Necessary scripts to visualize orbits
Points
plot_3d_points
 plot_3d_points (data:numpy.ndarray, labels:Optional[List[str]]=None,
                 plot_velocity:bool=True, arrow_width:float=0.005,
                 show_legend:bool=True, figsize:tuple=(10, 8))
Plots each point in space with a 3D arrow based on the first 3 coordinates (position) and optionally the next 3 coordinates (velocity).
| Type | Default | Details | |
|---|---|---|---|
| data | ndarray | Array of shape (samples, 3) for positions or (samples, 6) for positions and velocities. | |
| labels | Optional | None | Optional list of labels for color coding the points. |
| plot_velocity | bool | True | If True and velocities are provided, plot arrows representing velocity vectors. |
| arrow_width | float | 0.005 | Width of the arrows. |
| show_legend | bool | True | If True, show the legend for color coding. |
| figsize | tuple | (10, 8) | Size of the figure in inches (width, height). |
| Returns | None |
Orbits
Static
visualize_static_orbits
 visualize_static_orbits (data:numpy.ndarray,
                          time_instants:Optional[List[int]]=None,
                          orbit_indices:Optional[List[int]]=None,
                          point_dict:Optional[Dict[str,tuple]]=None,
                          show_legend:bool=True,
                          save_path:Optional[str]=None,
                          plot_reference_box:bool=True,
                          title:Optional[str]=None,
                          orbit_names:Optional[List[str]]=None,
                          equal_aspect:bool=False)
Visualizes orbits in 3D space and highlights specified time instants for each selected orbit. If data has 7 scalars instead of 6, the first scalar (assumed to be time) is removed.
| Type | Default | Details | |
|---|---|---|---|
| data | ndarray | The orbit data with shape (num_orbits, 6 or 7, num_time_points). | |
| time_instants | Optional | None | Time points to highlight; defaults to None. |
| orbit_indices | Optional | None | Indices of orbits to visualize; defaults to all. |
| point_dict | Optional | None | Dictionary of extra points to plot. |
| show_legend | bool | True | Flag to indicate whether to show a legend. |
| save_path | Optional | None | Path to save the figure; defaults to None. |
| plot_reference_box | bool | True | Flag to indicate whether to plot the reference box. |
| title | Optional | None | Custom title for the plot. |
| orbit_names | Optional | None | Custom names for orbits; defaults to “Orbit {index}”. |
| equal_aspect | bool | False | Flag to enforce equal scaling for all axes. |
| Returns | None |
visualize_orbits_minimal
 visualize_orbits_minimal (data:numpy.ndarray,
                           orbit_indices:Optional[List[int]]=None,
                           time_instants:Optional[List[int]]=None,
                           save_path:Optional[str]=None)
Visualizes orbits in 3D space with a completely blank background (no axes, no labels, no grid).
| Type | Default | Details | |
|---|---|---|---|
| data | ndarray | The orbit data with shape (num_orbits, 6, num_time_points). | |
| orbit_indices | Optional | None | Indices of orbits to visualize; defaults to all. |
| time_instants | Optional | None | Time points to highlight; defaults to None. |
| save_path | Optional | None | Path to save the figure; defaults to None. |
| Returns | None |
visualize_orbits_comparison
 visualize_orbits_comparison (data1:numpy.ndarray, data2:numpy.ndarray,
                              title1:Optional[str]='Set 1',
                              title2:Optional[str]='Set 2',
                              equal_aspect:bool=False, title_size:int=18,
                              title_pad:float=20.0,
                              shared_scale:bool=False, wspace:float=0.3)
Visualizes two sets of orbits side by side in 3D space.
| Type | Default | Details | |
|---|---|---|---|
| data1 | ndarray | First set of orbit data with shape (num_orbits, 6, num_time_points) | |
| data2 | ndarray | Second set of orbit data with shape (num_orbits, 6, num_time_points) | |
| title1 | Optional | Set 1 | Title for the first plot |
| title2 | Optional | Set 2 | Title for the second plot |
| equal_aspect | bool | False | Flag to enforce equal scaling for all axes |
| title_size | int | 18 | Font size for the plot titles |
| title_pad | float | 20.0 | Padding between plot and title in points |
| shared_scale | bool | False | If True, both plots will share the same scale and limits |
| wspace | float | 0.3 | Width spacing between subplots |
| Returns | None |
orbit_data= get_example_orbit_data()
orbit_data.shape
(400, 7, 100)visualize_static_orbits(data= orbit_data, orbit_indices=[315,120,70,180,190], point_dict=EM_POINTS)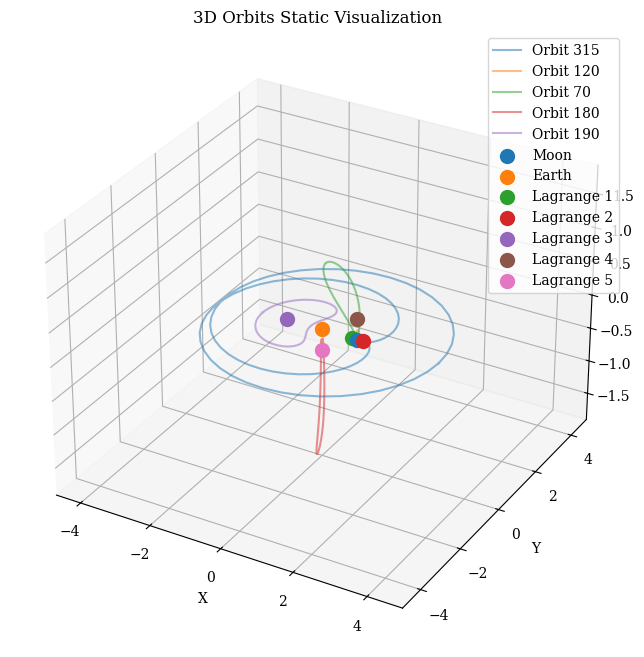
visualize_static_orbits(data= orbit_data, time_instants=[0,50], orbit_indices=[40], plot_reference_box=False)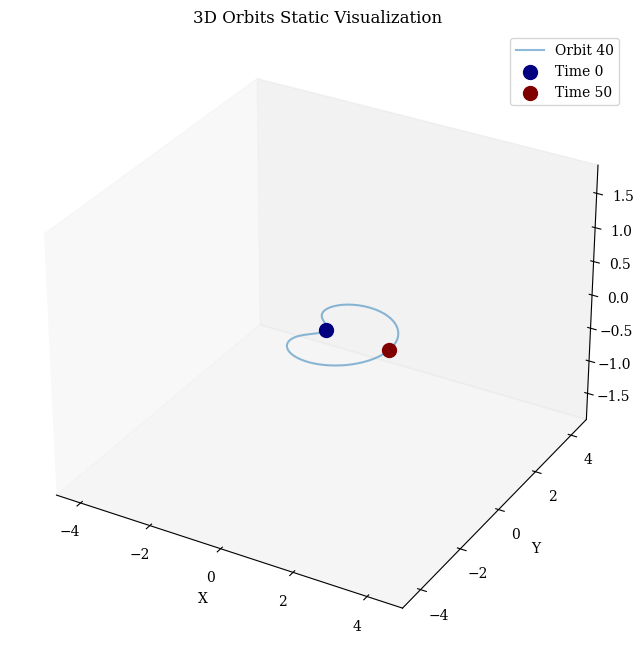
Dynamic
export_dynamic_orbits_html
 export_dynamic_orbits_html (data:numpy.ndarray,
                             time_instants:Optional[List[int]]=None,
                             orbit_indices:Optional[List[int]]=None,
                             point_dict:Optional[Dict[str,tuple]]=None,
                             filename:str='orbits.html')
Generates an interactive 3D visualization of orbits and saves it as an HTML file, including the ability to highlight specific time instants and show named points.
| Type | Default | Details | |
|---|---|---|---|
| data | ndarray | Orbit data as a 3D numpy array (num_orbits, 6, num_time_points). | |
| time_instants | Optional | None | Time instants to highlight. |
| orbit_indices | Optional | None | Indices of orbits to visualize. |
| point_dict | Optional | None | Named points as a dict with 3D coordinates. |
| filename | str | orbits.html | Path and name of the file to save the HTML plot. |
| Returns | None |
export_dynamic_orbits_html(data=orbit_data, filename='../data/example_training_data/example_orbits_visualization.html')Visualization saved to ../data/example_training_data/example_orbits_visualization.htmlOrbit Features
plot_histogram
 plot_histogram (data:Union[list,numpy.ndarray,pandas.core.series.Series],
                 bins:int=10, title:str='Histogram', xlabel:str='Data',
                 ylabel:str='Frequency')
Plots a histogram for the given data.
| Type | Default | Details | |
|---|---|---|---|
| data | Union | The data to be plotted | |
| bins | int | 10 | Number of histogram bins to use |
| title | str | Histogram | Title of the histogram |
| xlabel | str | Data | Label for the x-axis |
| ylabel | str | Frequency | Label for the y-axis |
| Returns | None |
plot_grouped_features
 plot_grouped_features (df:pandas.core.frame.DataFrame, columns:List[str],
                        group_col:str, plot_type:str, figsize:tuple=(5,
                        5), fontsize:int=10)
Group the DataFrame by a specified column and plot the specified type of plot for each column for each group.
| Type | Default | Details | |
|---|---|---|---|
| df | DataFrame | DataFrame containing the data. | |
| columns | List | List of column names to plot. | |
| group_col | str | Column name to group by. | |
| plot_type | str | Type of plot: ‘violin’, ‘box’, ‘facetgrid’, or ‘histogram’ | |
| figsize | tuple | (5, 5) | Size of the plot (width, height) per subplot |
| fontsize | int | 10 | Font size for labels and titles |
| Returns | None |
plot_value_proportions
 plot_value_proportions (data, grid:str='horizontal',
                         show_percentages:bool=True,
                         show_labels:bool=True,
                         percentage_font_size:int=10,
                         label_distance:float=1.1,
                         pct_distance:float=0.85,
                         explode_factor:float=0.1)
Count occurrences of each unique value in data and plot the proportions in pie charts.
| Type | Default | Details | |
|---|---|---|---|
| data | List or array of labels to plot | ||
| grid | str | horizontal | Option to plot in grid (horizontal, vertical, or square) or separate images. |
| show_percentages | bool | True | Option to print or not print percentages. |
| show_labels | bool | True | Option to print or not print labels. |
| percentage_font_size | int | 10 | Font size for percentages. |
| label_distance | float | 1.1 | Distance of labels from center. |
| pct_distance | float | 0.85 | Distance of percentages from center. |
| explode_factor | float | 0.1 | Factor to separate slices. |
| Returns | None |
plot_mean_distance_by_group_column
plot_mean_distance_by_group_column (df, group_column, value_column)
Dataframe
Correlation Matrix
plot_corr_matrix
 plot_corr_matrix (dataframe:pandas.core.frame.DataFrame,
                   figsize:tuple=(14, 10), cmap:str='coolwarm',
                   save_path:Optional[str]=None)
Plots a correlation matrix heatmap with annotations.
| Type | Default | Details | |
|---|---|---|---|
| dataframe | DataFrame | The DataFrame containing the data to be analyzed. | |
| figsize | tuple | (14, 10) | The size of the figure (width, height). |
| cmap | str | coolwarm | The color map to be used for the heatmap. |
| save_path | Optional | None | The path to save the plot image. If None, the plot is not saved. |
| Returns | None |
Features Summary
summarize_and_test
 summarize_and_test (df:pandas.core.frame.DataFrame, group_col:str,
                     features:List[str]=None, visualize:bool=True,
                     figsize:tuple=(10, 40),
                     plot_significant_only:bool=True,
                     plot_continuous:bool=False, show_values:bool=True)
Other
Images
plot_single_image
 plot_single_image (image_path:str, crop_length:int=0, font_size:int=17,
                    save_path:Optional[str]=None, figsize:tuple=(15, 15),
                    title:Optional[str]=None)
Plot a single image with customization options.
| Type | Default | Details | |
|---|---|---|---|
| image_path | str | Path to the image file. | |
| crop_length | int | 0 | Number of pixels to crop from each side of the image. |
| font_size | int | 17 | Font size for the title. |
| save_path | Optional | None | Path to save the plotted image. If None, the image is not saved. |
| figsize | tuple | (15, 15) | Size of the figure (width, height). |
| title | Optional | None | |
| Returns | None | Title for the image. |
create_image_grid_from_routes
 create_image_grid_from_routes (image_routes:list, crop_length:int=0,
                                font_size:int=12,
                                save_path:Optional[str]=None,
                                grid_size:tuple=(3, 2),
                                hspace:float=-0.37,
                                label_images:Optional[list]=None)
Create a grid of images from a list of image paths.
| Type | Default | Details | |
|---|---|---|---|
| image_routes | list | List of image file paths. | |
| crop_length | int | 0 | Number of pixels to crop from each side of the image. |
| font_size | int | 12 | Font size for the experiment label. |
| save_path | Optional | None | Path to save the generated grid image. If None, the grid is not saved. |
| grid_size | tuple | (3, 2) | Number of rows and columns in the grid. |
| hspace | float | -0.37 | Vertical spacing between grid rows. |
| label_images | Optional | None | |
| Returns | None | List of labels for images or a boolean to add default labels. |